


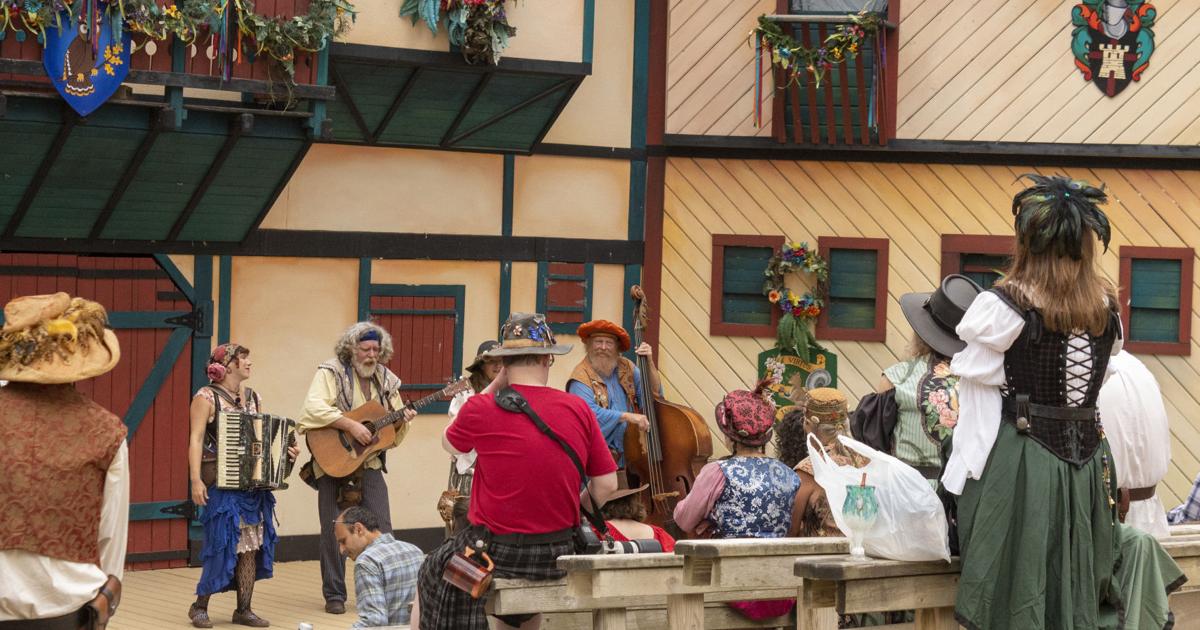
Kenosha County tourism almost returned to pre-pandemic levels in 2021 according to data released by the Wisconsin Department of Tourism, and now ranks 13th in the state for annual visitor spending, jumping five places from 2019.
With $231.9 million, 2021 marks Kenosha’s second highest level of visitor spending, just shy of the $239.7 million in 2019.
Kenosha County tourism collected $23.3 million in state and local tax revenues and accounted for 3,094 jobs with $99.6 million in related income.
Visit Kenosha President Dennis DuChene said 2021 was a strong year for Kenosha tourism, which saw less of an impact than other Wisconsin destinations because of Kenosha’s focus on leisure and sports. Those areas recovered relatively quickly from the pandemic slowdown, allowing Kenosha to jump so many places in ranking.
The only hamper to that return, DuChene said, was the continued shortage of labor in the leisure and hospitality industries. In Kenosha, total employment in those areas was down around 400 people from 2019.
People are also reading…
“So, as an employee, it’s a great time to enter that market,” DuChene said.
DuChene said 2022 was looking good, with people feeling safer to gather and travel as summer comes around.
“Almost all the events, plus some new ones are coming back,” DuChene said. “The only issue will be weather, but there’s nothing we can do about that.”
Wisconsin Tourism Ranking
The 2021 Top 15 Wisconsin counties for visitor spending:
- Milwaukee County
- Sauk County
- Dane County
- Waukesha County
- Brown County
- Walworth County
- Door County
- Outagamie County
- Vilas County
- LaCrosse County
- Oneida County
- Rock County
- Kenosha County
- Racine County
- Eau Claire County
DuChene was grateful to Visit Kenosha’s many business partners and the Kenosha community at large.
“Without them, we wouldn’t have the tourism product we have today,” DuChene said. “We’re looking forward to a busy summer.”
Based on visitor spending, Kenosha County ranks just above Racine County. Milwaukee County ranked the highest and Menominee County the lowest.
The states spend the most on parks and recreation
States Spending the Most on Parks and Recreation
While the travel and tourism industry took a major hit during the COVID-19 pandemic as more people elected to stay home and avoid travel, outdoor recreation has remained a bright spot. Recent data from the Outdoor Industry Association showed a 2.4 percentage point jump in total outdoor participation among Americans from 2019 to 2020. Outdoor activities of all types became an enticing alternative for people looking to get away from home while keeping their risk of spreading or contracting the coronavirus relatively low. The OIA data specifically estimated that 2020 saw 8.1 million more hikers, 7.9 million new campers, and 3.4 million additional freshwater fishers taking advantage of the great outdoors during COVID-19. This trend may also reflect larger shifts in people’s lifestyle preferences, as COVID-19 has inspired many workers to leave dense urban areas for locations where outdoor space is more plentiful. Interest in the outdoors is good news for state and local governments that fund parks and recreation. These governments invest in recreational sites not only for the health and leisure of their residents but also as an economic development tool. Studies have estimated that the outdoor recreation economy is responsible for more than 7 million US jobs and close to $900 billion of consumer spending annually—generating roughly $60 billion in tax revenue for state and local governments. These factors may help parks fare better when it comes to government funding than they did after the Great Recession. Following the last recession, state and local revenues were decimated nationwide, and parks and recreation became a target for budgetary cutbacks in many jurisdictions. During this time, total state and local spending on parks fell from an all-time peak of $48.5 billion in 2009 to $39.9 billion in 2013 (in inflation-adjusted 2018 dollars). Spending has resumed an upward trajectory since—but still has not returned to pre-recession heights, after adjusting for inflation.
imageBROKER / Alamy Stock Photo
State & local funding for parks & rec has grown in recent decades

Currently, overall spending on parks and recreation is led by states with larger populations and greater economic activity. California, Florida, New York, Illinois, and Texas are the biggest spenders, and they also represent the five largest economies and five of the top six largest populations. Per capita spending paints a different picture, as several states in the Midwest—including Illinois, North Dakota, and Minnesota—all ranked among the top five in the country. Mountain states like Colorado, Nevada, and Wyoming also spend among the most per capita. For many of these leading states, investments in parks and recreation are an important tool for generating economic activity. Developing parks and recreational sites around the state’s natural scenery helps bring in visitors—and dollars—to these states.
ND leads in parks & rec spending per capita but CA spends the most

To find these locations, researchers at CLIQ analyzed data on state and local government finances from the US Census Bureau and data on the outdoor recreation economy from the US Bureau of Economic Analysis. The researchers divided total parks and recreation spending in each state by the state’s population to rank the states with the highest spending per capita. The research team also gathered data on outdoor recreation’s economic effects, including the share of state GDP and the share of total state employment. Here are the states spending the most on parks and recreation.
15.Florida

Annual parks & recreation government spending per capita: $164 Total annual parks & recreation government spending: $3,516,038,000 Outdoor recreation share of state GDP: 4.4% Outdoor recreation share of total employment: 4.0% Population: 21,477,737
James Houlihan / Stockimo / Alamy Stock Photo
14. New Mexico

Annual parks & recreation government spending per capita: $164 Total annual parks & recreation government spending: $344,116,000 Outdoor recreation share of state GDP: 2.2% Outdoor recreation share of total employment: 3.1% Population: 2,096,829
Witold Skrypczak / Alamy Stock Photo
13.California

Annual parks & recreation government spending per capita: $173 Total annual parks & recreation government spending: $6,829,549,000 Outdoor recreation share of state GDP: 1.8% Outdoor recreation share of total employment: 2.4% Population: 39,512,223
imageBROKER / Alamy Stock Photo
12. Oregon

Annual parks & recreation government spending per capita: $176 Total annual parks & recreation government spending: $741,936,000 Outdoor recreation share of state GDP: 2.9% Outdoor recreation share of total employment: 3.4% Population: 4,217,737
Jerry Sanchez / Alamy Stock Photo
11.Alaska

Annual parks & recreation government spending per capita: $177 Total annual parks & recreation government spending: $129,214,000 Outdoor recreation share of state GDP: 3.9% Outdoor recreation share of total employment: 4.5% Population: 731,545
Ania / Alamy Stock Photo
10. Washington

Annual parks & recreation government spending per capita: $177 Total annual parks & recreation government spending: $1,346,121,000 Outdoor recreation share of state GDP: 2.0% Outdoor recreation share of total employment: 2.8% Population: 7,614,893
Thye Gn / Alamy Stock Photo
9. South Dakota

Annual parks & recreation government spending per capita: $182 Total annual parks & recreation government spending: $161,193,000 Outdoor recreation share of state GDP: 2.5% Outdoor recreation share of total employment: 3.3% Population: 884,659
8. Maryland

Annual parks & recreation government spending per capita: $189 Total annual parks & recreation government spending: $1,142,153,000 Outdoor recreation share of state GDP: 1.7% Outdoor recreation share of total employment: 2.3% Population: 6,045,680
Ethan Shaw / Alamy Stock Photo
7. Hawaii

Annual parks & recreation government spending per capita: $221 Total annual parks & recreation government spending: $312,473,000 Outdoor recreation share of state GDP: 5.8% Outdoor recreation share of total employment: 5.9% Population: 1,415,872
Westend61 GmbH / Alamy Stock Photo
6. Wyoming

Annual parks & recreation government spending per capita: $229 Total annual parks & recreation government spending: $132,673,000 Outdoor recreation share of state GDP: 4.2% Outdoor recreation share of total employment: 5.2% Population: 578,759
Robert Garrigus / Alamy Stock Photo
5.Nevada

Annual parks & recreation government spending per capita: $233 Total annual parks & recreation government spending: $717,944,000 Outdoor recreation share of state GDP: 3.1% Outdoor recreation share of total employment: 3.1% Population: 3,080,156
Edwin Verin / Alamy Stock Photo
4. Illinois

Annual parks & recreation government spending per capita: $240 Total annual parks & recreation government spending: $3,045,451,000 Outdoor recreation share of state GDP: 1.8% Outdoor recreation share of total employment: 2.1% Population: 12,671,821
Eddie Rodriquez / Alamy Stock Photo
3.Minnesota

Annual parks & recreation government spending per capita: $248 Total annual parks & recreation government spending: $1,401,314,000 Outdoor recreation share of state GDP: 2.4% Outdoor recreation share of total employment: 2.6% Population: 5,639,632
Viktor Posnov / Alamy Stock Photo
2. Colorado

Annual parks & recreation government spending per capita: $270 Total annual parks & recreation government spending: $1,553,503,000 Outdoor recreation share of state GDP: 3.1% Outdoor recreation share of total employment: 3.8% Population: 5,758,736
charles nolder / Alamy Stock Photo
1. North Dakota

Annual parks & recreation government spending per capita: $425 Total annual parks & recreation government spending: $324,086,000 Outdoor recreation share of state GDP: 2.2% Outdoor recreation share of total employment: 2.9% Population: 762,062
EricksonPhotography / Alamy Stock Photo
Get the latest local business news delivered FREE to your inbox weekly.

Comments are closed.